
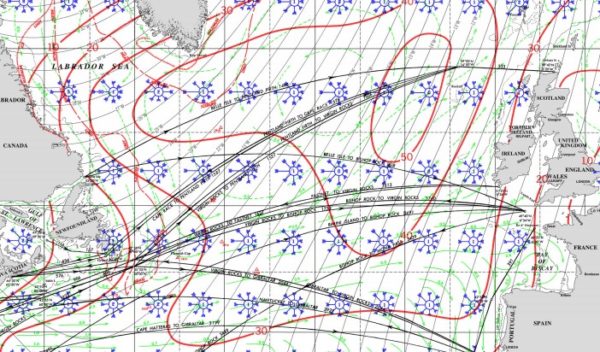
What is a pilot chart?
A pilot chart is a map showing monthly statistics based on over 100 years of weather observations — essentially, the typical weather conditions for a given location and month.
It provides information such as average wind (direction and strength), waves, pressure, visibility, currents, air and sea temperature — as well as typical cyclone tracks and ice limits.
It’s a valuable tool for planning a round-the-world voyage, long ocean passages, or a transatlantic crossing.
Pilot charts are made available free of charge by the U.S. National Geospatial-Intelligence Agency (NGA). You can view all of their publications ↗.
Download pilot charts
View or download the monthly pilot charts for the world’s oceans in the table below: North Atlantic (Atl N), South Atlantic (Atl S), North Pacific (Pac N), South Pacific (Pac S), and Indian Ocean.
Pilot charts for the Mediterranean are included within the North Atlantic section.
| Atl N | 2002 | 1 | 2 | 3 | 4 | 5 | 6 | 7 | 8 | 9 | 10 | 11 | 12 |
| Atl S | 1995 | 1 | 2 | 3 | 4 | 5 | 6 | 7 | 8 | 9 | 10 | 11 | 12 |
| Pac N | 1994 | 1 | 2 | 3 | 4 | 5 | 6 | 7 | 8 | 9 | 10 | 11 | 12 |
| Pac S | 1998 | 1 | 2 | 3 | 4 | 5 | 6 | 7 | 8 | 9 | 10 | 11 | 12 |
| Indien | 2001 | 1 | 2 | 3 | 4 | 5 | 6 | 7 | 8 | 9 | 10 | 11 | 12 |
What next?
As you’ve probably gathered, the data provided here are statistical averages. They should only be used when planning offshore passages — for following the major routes that connect the continents, the same routes sailors have taken for thousands of years.
A few days before departure, you can (and should) consult the offshore forecasts and GRIB files for your specific sailing area.
Any questions? Let’s discuss in the comments 👇